Data & Tools
The LIO has developed an interactive webmap with relevant GIS data for each of the eight focus area. The webmap can be used to identify and prioritize potential projects to protect and restore the health of the Puyallup Watershed.
Click the image above to access the interactive webmap. Click on the layers icon in the upper right corner to access data layers, which are arranged in ten categories:
- Priority Layers, which shows the highest priority locations for potential projects for each of the eight focus areas
- Focus Area Categories, which include additional data layers to inform project prioritization or general information gathering about each focus area
- Other Information, which includes census block, legislative and congressional district, and biodiversity network layers.
Floodplains and Other Priority Layers
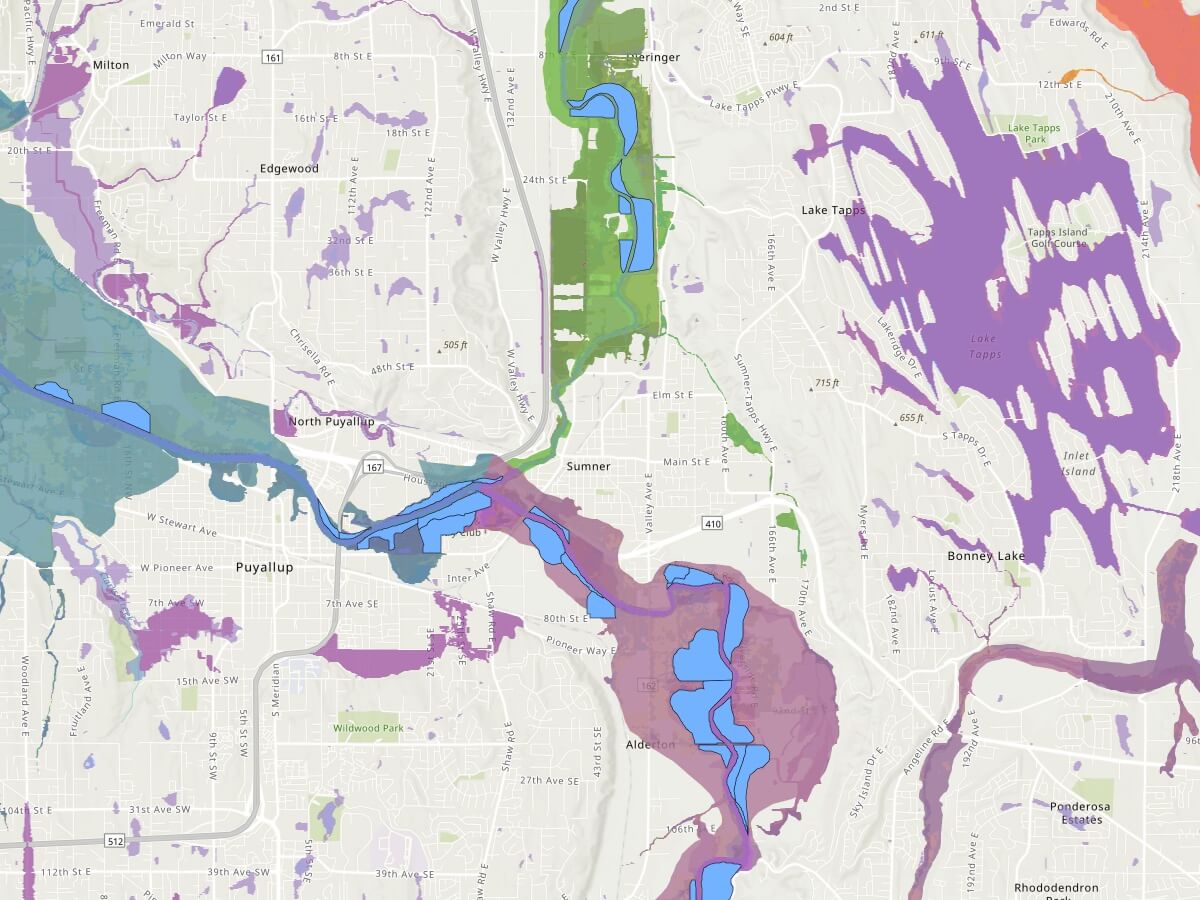
For example, an LIO member or other restoration planner may want to use the web map to identify where certain priority areas overlap with floodplains – which could either indicate high flood risk that should be addressed or areas for potential multi-benefit projects that reduce flood risk while making improvements other priorities. In the Floodplains category, turn on either the FEMA Flood Hazards layer (if interested in the regulatory floodplain) or the Floodplain Planning Area layer (if interested in an approximation of the historic floodplain prior to the construction of levees). Then, in the Priority Layers category, turn on any other priority layers of interest. For example, turn on the Agriculture – Conservation layer to identify which high priority agricultural parcels are located in the floodplain. Or turn on the Salmon layer to identify high priority areas for salmon restoration that overlap with floodplains.
Development Pressure on Farmland
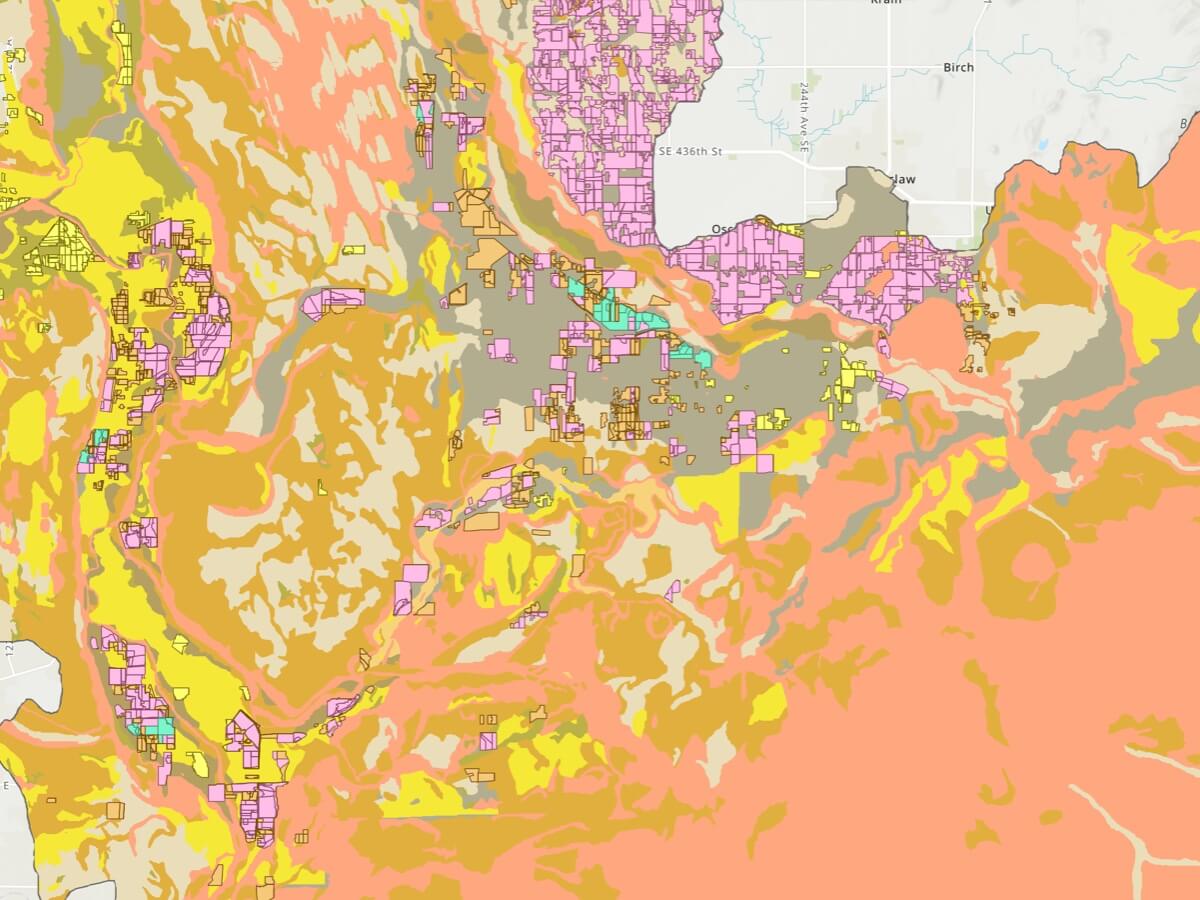
The Farms & Agriculture category includes layers that can be used to explore pressures on farmland. Turn on the Actively Farmed 2019 layer to show active farmland in the watershed. Then turn on the Actively Farmed within UGAs, Actively Farmed in Non-Ag Zoning, and Actively Farmed along Transportation Improvements to highlight those farmland areas at risk from development pressure due to zoning, inclusion in an urban growth area, or proximity to a planned road project. Turn on the SSURGO layer to show which of those parcels at higher risk of development are classified as prime farmland.
Equity and Access to Open Space
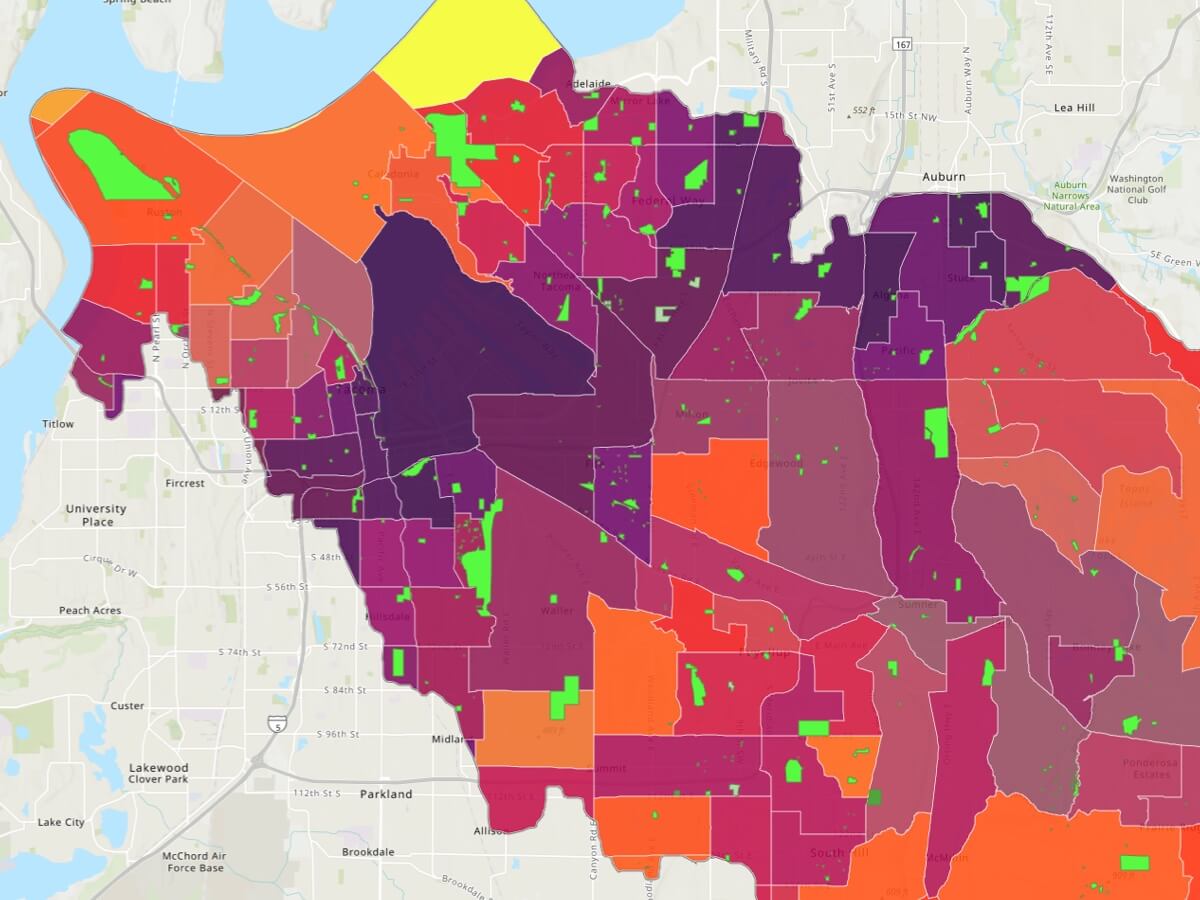
If an LIO member is interested in exploring access to open space and its relationship to other indicators of equity, they can turn on the Equity and Human Well Being – Access to Open Space layer in the Priority Layers category. This layer highlights areas within cities or urban growth areas that are a half mile or greater from a park. In the Equity and Human Health category, turn on the Socioeconomic Factors layer to show how census tracts in the watershed rank in terms of vulnerability due to socioeconomic factors. Tracts that rank an 8, 9, or 10 have the highest equity concerns; look to areas where those tracts have low access to open space to identify potential locations for priority new parks. Note that the Port of Tacoma area rates as high for equity concerns and for lack of access to open space, but as an industrial area it may not be a high priority; this is an example of the fact that this web map tool provides a starting point but that additional local knowledge is always helpful to contextualize results.
Forests
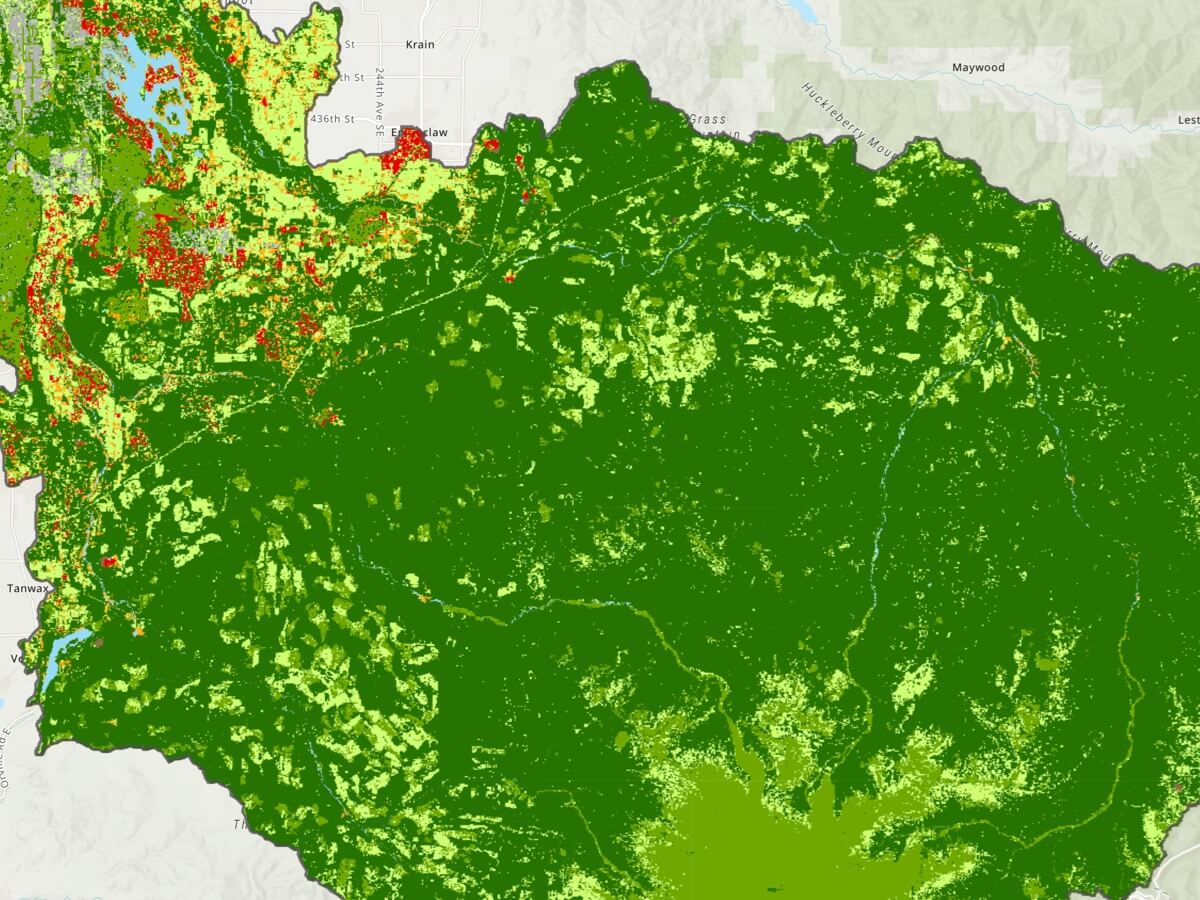
There are two priority layers for the Forests focus area – one showing priority areas for protection and one showing priority areas for increasing forest cover. Turning both layers on clearly shows the difference in focus in different areas of the watershed. The upper watershed portions of the Carbon River watershed is high priority for forest protection, while vast swathes of the lower-lying areas of the watershed, within city boundaries, has been identified as high priority.
Civic Engagement Toolkit
Influencing Policy and Planning: A Civic Engagement Toolkit was developed by Forterra for the Pierce conservation District, Puyallup River Watershed Council, and Puyallup Watershed Initiative. The purpose of the Toolkit is:
“… to create a well-informed, well-organized, and well-prepared community – one that is ready to participate in policy and planning processes that affect their neighborhoods and people. Community members who are knowledgeable about these processes and are proactive with their engagement can have a powerful influence on local land use decisions that shape the future of their communities.
This publication is for practitioners, community members, and other stakeholders in policy and planning decision-making that impact the watershed. The material included in this toolkit is a synthesis of information drawn from interviews with current and former elected officials, community members, and staff members of organizations that have worked on engagement efforts; research into best practices and available tools included in other toolkits; and feedback from community members and practitioners.”
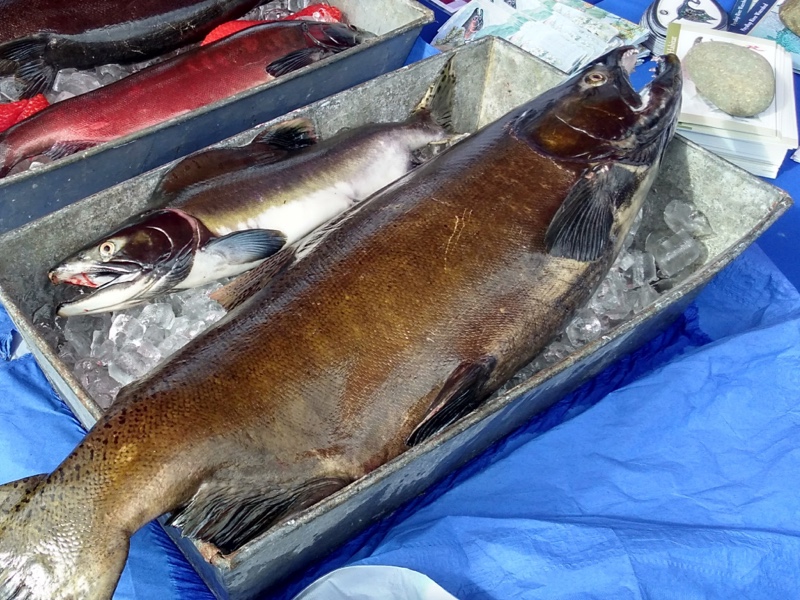
Salish Sea Salmon on iNaturalist.org
We are tracking salmonid species observations in Puget Sound and the Salish Sea including spawning adults, juveniles, redds, and salmon carcasses. While this collection was created by partners of the annual Puyallup Watershed Salmon Homecoming Celebration, it is open to and includes all watersheds draining to the Salish Sea watershed.
